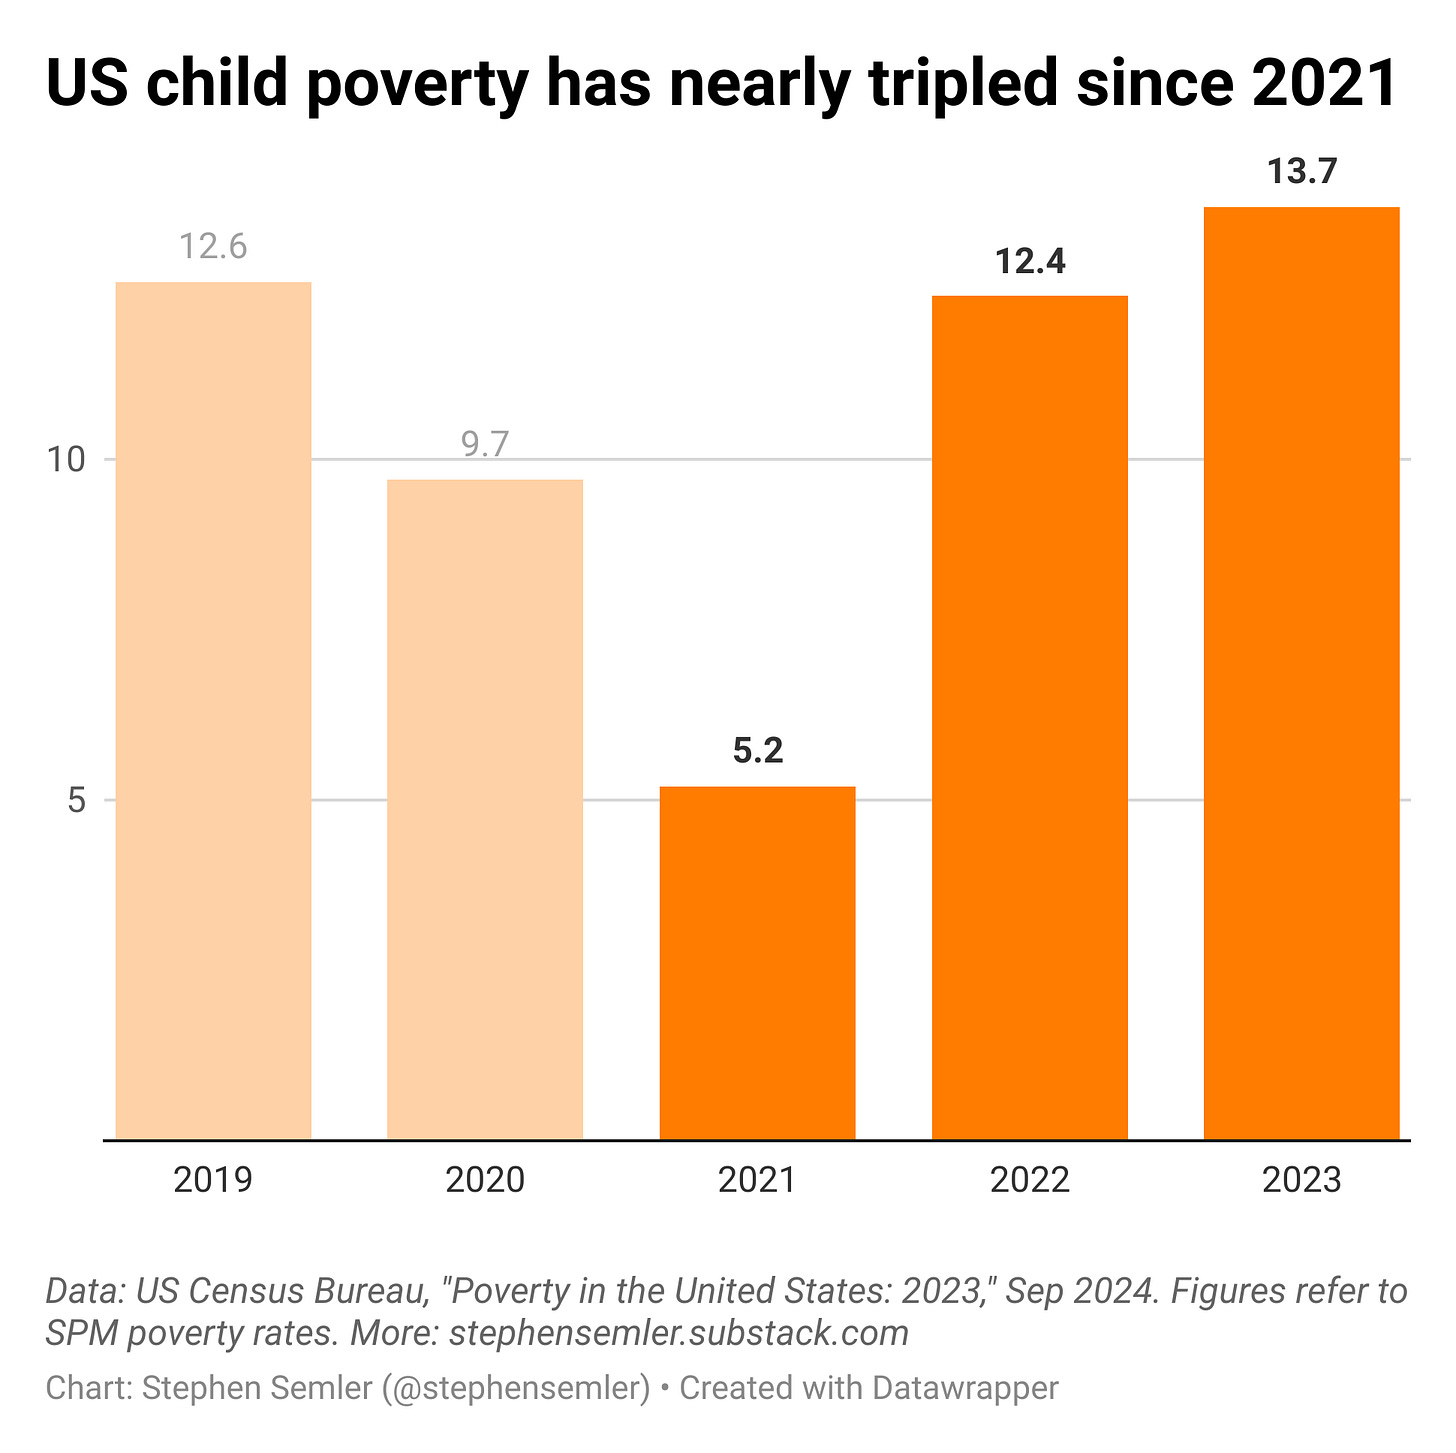
US child poverty nearly tripled between 2021 and 2023
Polygraph | Newsletter n°265 | 10 September 2024
*Big thanks to Frank R. for becoming Polygraph’s latest paid subscriber. Frank and the other names listed at the bottom of this note keep this newsletter going. Please join them!
Situation
Poverty in the United States increased for the second year in a row according to the annual Census Bureau report on poverty released earlier today.1
From 2022 to 2023, the number of Americans in poverty increased 5 percent, from 41 million to 43 million people. Expressed as a share of the total population, the US poverty rate increased from 12.4 to 12.9 percent. Among children, the poverty rate increased from 12.4 to 13.7 percent.
In 2021, the child poverty rate was 5.2 percent.
^Alt text for screen readers: U.S. child poverty has nearly tripled since 2021. In 2019, the child poverty rate was 12.6 percent; in 2020, 9.7; in 2021, 5.2; in 2022, 12.4; in 2023, 13.7. Data: U.S. Census Bureau, “Poverty in the United States: 2023,” September 2024. Figures refer to SPM poverty rates.
What happened
Federal benefits and tax breaks were taken away during a serious bout of inflation. The Census Bureau attributes the increase in child poverty since 2021 to the expiration of pandemic-era anti-poverty programs, many of which were enacted or extended through the American Rescue Plan. For example, the child tax credit lifted 2.4 million people out of poverty in 2023, but the expanded child tax credit moved 5.3 million people above the poverty line in 2021. The expanded version expired in 2022.
^Alt text for screen readers: Several key U.S. anti-poverty measures expired or were eliminated after 2021. A snapshot of enhanced coverage from 2020 to 2023. This range chart plots the start of new health and anti-poverty initiatives in green and their end in red. Eviction ban, September 4, 2020 through July 31, 2021; extended unemployment coverage, May 5, 2020 through September 4, 2021; additional unemployment benefits, December 27, 2020 to September 30, 2021; child tax credit expansion, January 1, 2021 to December 31, 2021; earned income tax credit expansion, January 1, 2021 to December 31, 2021; free school meals, March 16, 2020 to June 30, 2022; emergency food aid, March 18, 2020 to February 28, 2023; Medicaid expansion, March 18, 2020 to March 31, 2023; student loan pause, March 13, 2020 to September 30, 2023; child care provider grants, April 15, 2021 to September 30, 2023; increase to the Special Supplemental Nutrition Program for Women, Infants and Children, June 1, 2021 to September 30, 2023.
SPECIAL THANKS TO: Alan F., Andrew R., Bart B., BeepBoop, Bill S., Byron D., Chris G., David S.,* David V.,* Francis M.,Frank R., Gary W., George C., [Podcast by George]Hans S., Irene B., James H., James N., Jcowens004, Jerry S., John A., Joseph B., Kheng L., Linda B., Linda H., Lora L., Marie R., Matthew H.,* Megan., Meghan W., Nick B., Omar D.,* Peter M., Philip L., Rosemary K., Silversurfer7, Spookspice2, Springseep, Theresa A., Themadking724, Tim C., [Orca Cascadia]Tony L., Tony T. Viviane A.
* = founding member
-Stephen (Follow me on Instagram, Twitter, and Bluesky)
The poverty figures discussed here refer to the Supplemental Poverty Measure (SPM), not the Official Poverty Measure (OPM). As far as measures of economic well-being go, SPM is far superior: It takes into account federal benefits, taxes, and necessary expenses while OPM does not. For a comparison between SPM and OPM, see here or here.


