*Big thanks to Bob N. for joining Polygraph’s esteemed list of paid subscribers. Bob and the others listed below help keep this newsletter going. Please considering joining them here:
Situation
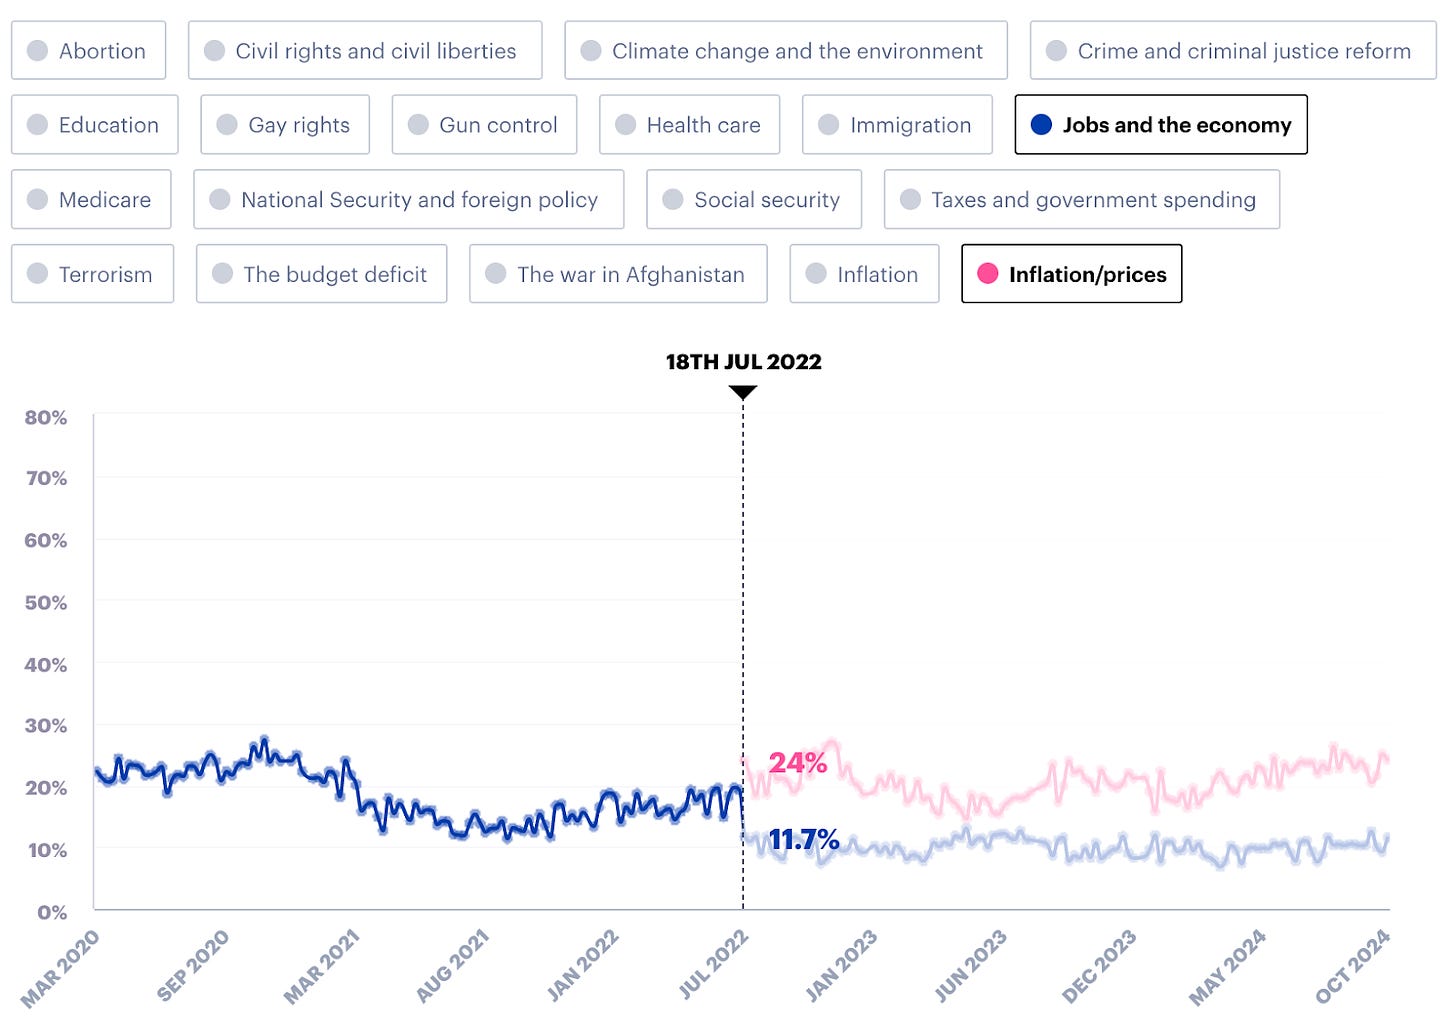
The longest a song has spent atop the Billboard Hot 100 list was 19 weeks, but voters have ranked cost of living as the most important issue facing the US for the last 119 weeks. YouGov added “inflation/prices” to its issue list in mid-July 2022 and it’s been the top reported concern ever since. As of this week, 25% of all voters say it’s their number one issue. By comparison, immigration and abortion stand at 15% and 9% respectively, and those are really salient topics.
This is in line with what other polls have found.
Two economic narratives
One is about the national economy; the other talks about people’s experience living in it. The former narrative references macroeconomic indicators like GDP and unemployment; the latter’s got data on cost of living and financial hardship.
When voters are asked about “the economy,” their responses include both of these narratives. The poll I just mentioned demonstrates that. The week before YouGov started asking about cost of living in mid-July 2022, “jobs and the economy” was voters’ top issue, polling at 19.2%. But as the screengrab below shows, after “inflation/prices” was added as an option, “jobs and the economy” immediately plummeted to 11.7%.
Here’s what I think happened. Before mid-July 2022, many respondents primarily concerned about cost of living selected “jobs and the economy” because it was the issue area that was most closely related to their top concern. But once YouGov added “inflation/prices,” those respondents suddenly had a better, more precise option with which to express that top concern. Does that make sense?
Economic health at the national and human level
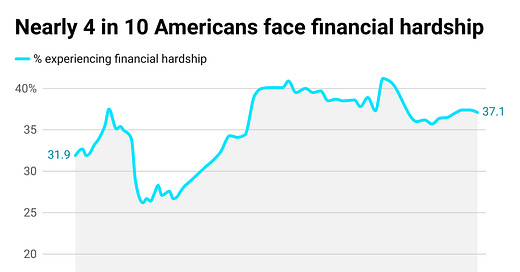
The rising cost of living hasn’t impeded the country’s impressive economic growth, but it has devastated many people’s economic well-being. So while every macroeconomic indicator I can think of shows remarkable improvement compared to 2020, I’m still able to give you three measures of economic precarity that all got worse since 2020. Here they are, listed from least to most severe. (I’ll make a chart for the middle one.)
% living paycheck-to-paycheck—
2020 avg: 61.3
Latest reading: 66.4
% having difficulty paying for basic necessities—
2020 avg: 33.7
Latest reading: 37.1
% living below the poverty line—
2020: 9.2
Latest reading: 12.9
^Alt text for screen readers: Nearly 4 in 10 Americans face financial hardship. This line graph shows the percentage of Americans facing financial hardship, beginning with 31.9 percent in August 2020, and rising, then falling, then rising again, then staying relatively steady before arriving at 37.1 percent in September 2024. Data: U.S. Census Bureau. Figures refer to the share of people reporting difficulty paying for basic household expenses in the last 7 days. More at stephen semler dot com.
SPECIAL THANKS TO: Alan F., Alex T., Andrew R., Bart B., BeepBoop, Bill S., Bob N., Brett S. Byron D., Chris G., David S.,* David V.,* Elizabeth R., Francis M., Frank R., Gary W., George C., Griffin R., Hans S., Irene B., Isaac S., James H., James N., Jcowens004, Jerry S., Joe R., John A., Joseph B., Kheng L., Linda B., Linda H., Lindsay S.,* Lora L., Marie R., Matthew H.,* Megan., Meghan W., Michael S., Nick B., Omar D.,* Peter M., Philip L., Rosemary K., Silversurfer7, Spookspice2, Springseep, Theresa A., Themadking724, Tim C., Tony L., Tony T., Viviane A.
* = founding member


